Keywords: Excel, custom labels, XY plot chart, scatter plot, macro
Version: Tested on Excel 2003 and Excel 2007
Download:
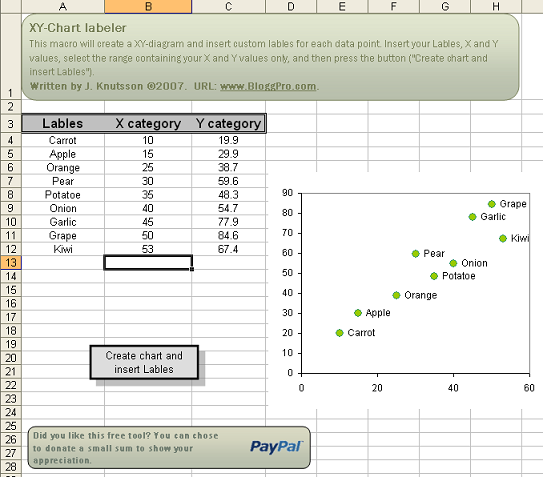
Quite frequently there is a need to display custom lables in a standard Excel XY-plot. Unfortunately Excel lack a native function to insert custom labels; the only options available are Series names, x- and y-values which often are totally inappropriate. I created a workbook with a macro that allows the user to insert the X and Y data along with the desired lables and create a labled scatter plot with the click of a button. See image below.
All you have to do is to dowload the file, insert your labels and values and click the button! The chart may require some additional formatting to suit your needs. Enjoy!
Download: Click here
Popularity: 17% [?]
Hi Jesper,
Can’t seem to download your file. Any hints?
Cheers,
Frank.
Try this:
http://support.microsoft.com/kb/213750
When you publish the chart as a webpage with interactivity, i would like this to work. How do i make that possible.
This macro cannot be used for multiple series, a modification would be needed. Not sure I will have time to look at this now.
Cheers
Is there a way to plot multiple series (labeled) using this macro? This works great for single series, no matter how large, but does not allow me to plot multiple series with labels. Thanks!
Mail sent, Bill
Can someone contact me to 1) learn how to transport this macro between spreadsheets and 2) tell me to how I can make a financial contribution? BTW, I tend to run into run-time errors fequently. Not sure why this happens.
Thanks
Bill
Great job, just a comment on label placement. If there is more than one data label with same x/y value then data labels overlaps – this reduces the readability of data labels. Thanks a lot, Anil
It works with my 2007. Try to enter new values in the Y category to make sure it’s not the formula messing things up.
Just tried it in 2k7 and it doesn’t work.
Whenever I try using the above script I keep running into an error. I am thinking that maybe I don’t have all of the correct references, but I was hoping someone coudl confrim.
Thank you again!
Avery